Developing compute-over-data for geospatial data processing: an overview
By Dhruv Malik, Web3 dev Extra Labs
This article provides a technical overview of the compute-over-data framework developed at Extra Labs for building of Circum Protocol. for a general overview about the algorithm, follow our last article here.
We will explain in detail the subject of computing geospatial data, its challenges, and the way compute over data (COD) can shift the paradigm by using web3-based physical network ecosystem (DePIN/DeREN) to run large-scale use cases.
Current paradigm for geospatial data processing
Geospatial data processing is one of those vast frontier of big data analysis . in general, it consist of the representation of the measurement of physcial characterstics of the given geography / large scale infrastructure (3D lidar scans , enviornment factors, public infrastructure, etc) in order to present the accurate mapping of the condition of the given region in 3D maps.

It has always faced the significant constraints of scalability, security and cost management. primarily being the creation of scalable data ETL (Extract-Transform-Load) framework to work across heterogeneous raw datasets, also has the following issues:
- providing security and permissioned access to high quality sensor datasets
- high cost associated with data acquisition and the corresponding ROI.
- Provide comparable performance and reliability of services compared to industry giants
Therefore, an alternative IT infrastructure is needed for running Geospatial platforms that addresses the challenges addressed above. We believe this infrastructure should public good for institutions such as municipalities and state governments’ to better get idea about their current infrastructure in order for sustainable development along with helping in natural disasters to better understand the nature of destruction to save people.
Components of current Compute platforms

In general there are 3 stages in a GIS pipeline: data engineering, computing and visualization. Let’s breakdown each of them independently, taking our use case of on-demand 3D surface reconstruction as an example.
1. Data engineering stage
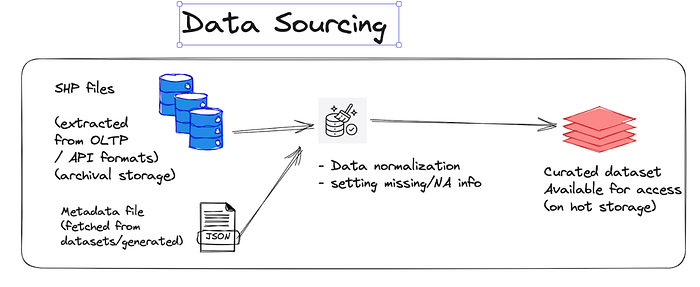
A geospatial data model is the combination different layers of features that are represented as either a raster model (aka pixels, stored as common image format like PNG, JPEG…) or a vector model (aka algebraically determined lines, stored in shapefiles SHP). These data model can convey a huge diversity of information, from geographical terrain to buildings, roads, localities, temperature, etc.
Once the geospatial data is modeled, it needs more contextual information in order to understand the nature of the dataset and how to interpret it. This information will be stored in the metadata, which includes the data pipeline information, the scale of the model etc. The main format for doing this is GeoJSON. It is a JSON file that defines the characteristics of SHP images, like coordinates (as point/polygon format), description, device used for the collection, scale, etc.
Most of the GIS data processing aims at performing the following computation operations:
- For raster image: converting the various 2D topographical parameters (height, terrains, objects…) into a corresponding color on the map.
- For vector model: converting raster image gathered from varied sources (satellite image, photogrammetry from drones…) into algebraic expression or processing existing vector models to stitch them together. It includes algorithms like surface reconstruction or structural analysis.
For Extra, our main focus is to provide users with high detailed 3D modeling of precise infrastructure / civil buildings. As such, we are primarily working on curating and applying algorithms on vector based shapefiles (defined in formats like SHP, KML etc.).
Thus, these files are fetched from the data sources (in our case being the french geospatial agency IGN geoservices), decompressed and then stored with indexation in the cloud storage. Based on the file sizes and the category of data that is to be accessed, we only take a certain portion of the data that is to be processed by the algorithm into the cache SSD storage and remaining data rests in object/archive storage.
These data files are indexed using the GeoJSON data format / RDBMS format and the corresponding stored files are available as API’s by the computation microservices.
2.Computation pipeline
Once we have curated data conformed to the required input standard for the computation that we are planning, it’s time to pass it to the deployed microservices in batch.
If we focus on the microservices used in Extra Labs activities, they are essentially scripts that process points clouds from LiDAR (.las data model) into a polygon-based model.
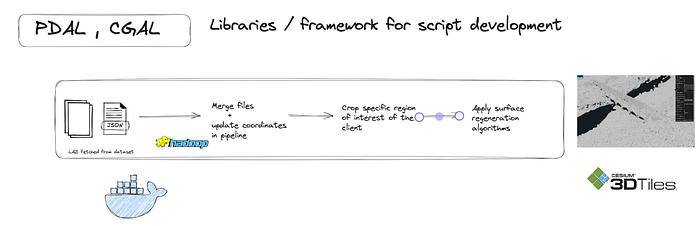
Thus, the following libraries are used to develop in our data pipeline:
- PDAL: C/C++ open source library and applications for translating and processing point cloud data. Meant to help developers compose operations on point clouds into pipelines of stages.
- CGAL: C++ open source library that has built in packages for running a lot of geometric operations such as triangulations, voronoi diagrams, boolean operations on polygons, arrangements of curves, surface and volume mesh generation, etc. This is crucial for 3D surface reconstruction, which tries to generate the 3D representation of the given region defined by the given user.
- Geopandas: Python library for superimposing the resulting las file from pipeline to the geocoordinate files.
- Open source rendering packages like 3DTilerenderingJS.
That works as follows:
- First, all the shapefiles (in the compressed .laz format) are merged based on the description of their respective alignment and the coordinate space standard defined in the metadata (for example here). In our case we are mostly using the EPSG:2154 format for the French region.
- Then on this coalesced dataset, we will crop the corresponding region of interest which needs to be rendered to the user. This can be determined as a point region (as a latitude and longitude of the given area) or the polygon region (bound by the certain region of max to min for both longitude and latitude).
- The next step is the assignment phase, where we define the characteristics of the metadata file for our newly cropped area. For example, in our case, we define the sections of the cropped area based on the height, density of construction, or quality of the point cloud data that we can recover from the datasets. The rendering engine will parse this information to generate appropriate colors and create corresponding depth maps.
- After defining the input file, the corresponding final image of the surface reconstruction algorithm is generated using the CGAL library. This library takes the point cloud as input and attempts to generate contours by first going through a pre-processing phase. This phase smooths out any incomplete regions in the point cloud and connects all the regional meshes of the given structure/region point cloud data. The resulting file is in the .las format.
This data pipeline is executed on big data computing frameworks (such as Hadoop) to perform transformation tasks across large-scale rendering of neighborhoods and merging their results. These data pipelines will be further improved by integrating machine learning/transformer models to perform tasks such as generating more metadata characteristics based on the detection and classification of regions in the reconstructed LiDAR image, or creating realistic video demonstrations for drone views (also known as NeRF).
3. Visualization
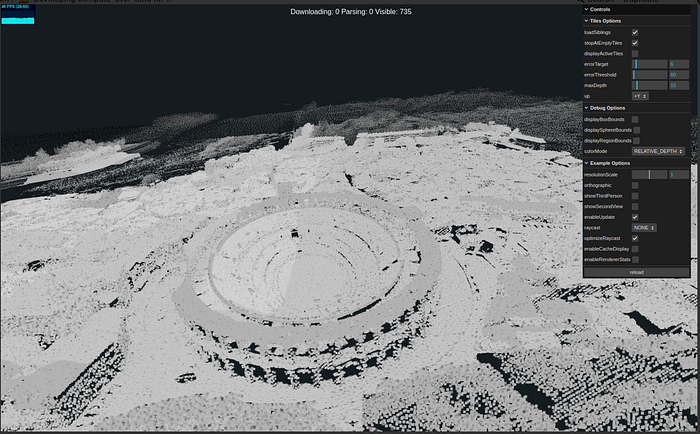
Once the corresponding algorithm and transformations are run on top of the dataset, now on the side of client, they need to see the results of the detailed format. Based on the nature of the output file (3Dtiles format, reconstructed mesh image), we can use either of the following methods in order to refer the result and do further operations:
- Using Jupyter notebook + py3dtiles (example) to render the output and further transformations (ideal for geospatial analyst).
- Using open source framework like NASA’s 3DTilerenderJS that allows the rendering of various computed 3D mesh / point cloud maps for the given region on the browser.
- Using other commercial offerings (like Cesium, Geopipe…) etc.
These systems are better suited for domain-specific geocomputation / ETL (Extract Load Transform) tasks that require only limited spatial information. For example, this ETL tutorial visualized limited non-real-time data. Indeed they are:
✅Easier to set up.
✅The type of dataset is good and doesn’t require extensive data cleaning and serialization tasks.
✅Only consist of general identifiers and no PII.
However, scaling this to include larger use cases such as modeling digital twins of cities and architecture or facing natural disasters presents massive challenges due to:
❌Exorbitant compute and storage cost associated w/ storing the state of the models.
❌Bottleneck for scheduling and parallelization of jobs along with insuring resiliency of the given job computation along with data/MLOps becomes more complex.
This issue is even prevalent among big firms (such as Google Maps’ real-time traffic analysis at the last IO event) due to which they had to use a scaled-down version of the real-time digital twin due to problems with the traditional web2-based infrastructure and the resulting cost issues.
Proposed architecture for a compute-over-data alternative
Compute-over-data (COD) shifts the computing paradigm by running compute jobs where the data is stored, instead of sending the data to the computing process. Compared to cloud-based systems, COD reduces the workload of data management and ensures consistent storage and access control for the user’s dataset.
One of the main open source frameworks currently available is the Bacalhau project, incubated by Protocol Labs. Bacalhau provides secure and cost-efficient computation for jobs on large-scale datasets. It relies on IPFS and Filecoin to store the intermediate state of the current network, by putting the hash proofs of the executed compute operations or relaying back the resulting output (either a file or serialized data).
Similar to the well-known container orchestration framework K8S, Bacalhau also manages the assignment of compute resources for various decentralized compute systems, which can be defined or undefined.
This significantly resolves the challenges that typical web2-based compute platforms face like:
- Reducing the need for setting up initial stages of ETL, as the job execution is atomic and doesn’t require any data transformation separately. the whole operation is done in the single compute operation by streaming the data from the data source.
- Does not relinquish user access over data throughout the operation lifecycle.
- Uses decentralized/distributed data storages which are resilient in storage or data corruption and costs less.
- Is scalable, as you can orchestrate various compute jobs. However it depends of on how your framework handles the job synchronization issues, that will be addressed in the upcoming “challenges” section.
Bacalhau consist of the following major components:
- Requester Node: That’s the entry point of the compute framework that insures:
- That requestor of the compute resource correctly defines the compute job description as JSON format
- Once relayed, it disburses the job requests in the network and waits for the response of the compute node.
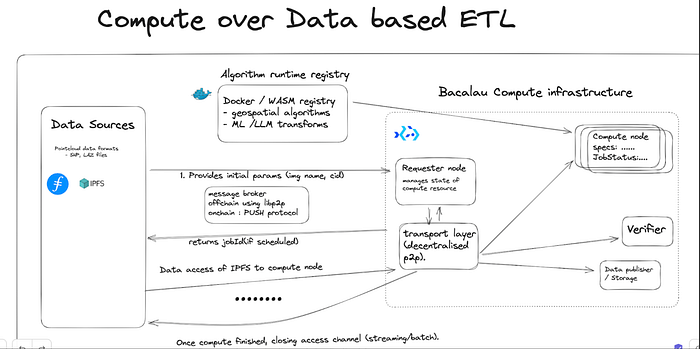
- Compute Node: It responds to the requestor’s bid if it has available bandwidth. Then, it fetches the runtime of the specified application and executes it with the given input parameters, which are generated from the data store of the Docker/WASM runtime entry points.
- Interfaces between the external module services:
- Verifier: Stores the hashmap of the results of various compute jobs and their corresponding status to maintain the state of the given compute node. A requesting node can easily check the Verifier node to determine the available bandwidth.
- Executor: provides adaptability to the various runtimes (for now Docker, WASM) in order to run more compute jobs compatible to specific runtimes.
- Storage Provider: Bacalhau typically uses a decentralized storage system. However, to ensure compatibility with the current structured environment (POSIX), interface modules are available for easy integration of container apps with different categories of storage.
In addition, we have been exploring ways to create a sustainable model for ecosystem players, including:
- Data collectors of all categories (from photographer doing photogrammetry scans to LiDAR, satellite images etc.).
- Data buyers, based on either ocean marketplace, B2B/C ecosystem partners, data unions etc.
- Storage/infrastructure providers that run their compute/storage infrastructure nodes (with varied levels of availability) based on their staked rewards.
Thus we are currently working on integrating with the lilypad network, a wrapper on top of Bacalhau. This network consists of smart contracts that enable users to pay others in the utility token. Based on the availability of compute resources, the network schedules the computation and users pay only when they accept the job result.
Proposed Workflow:
The above diagram is simply explained in the following components:
- Docker registry consisting of following jobs:.
- Docker container for running data migration job;
- Container for running geospatial data engineering algorithms like:
- Surface reconstruction, conversion of file format, 3DTile generation
- Container for running the post visualization job
- Bacalhau network (hosted on either private or public instance).
- Serverless persistent application to run jobSpec on the Bacalhau network.
- User frontend (either via CLI or application).
The workflow is as follows:
- Data Engineering process consist of running cron jobs of fetching the data from the corresponding API’s and then transferring to the decentralized storage (via private gateway services like web3.storage). This is done via a serverless script that invokes the data migration compute job from the Bacalhau resource node.
- Once the data is migrated, we take the user input (geo-locations of the specific foundations that he want to calculate along with the category of operation that he wants to run) which then fetches the docker container from the container registry, along with the generation of the corresponding results.
- Once the docker container is fetched to the assigned compute node, it runs the relevant transformations on the data. For large jobs, the data is streamed from the given input job.
- Once the corresponding compute job is finished, it submits the proof of execution on the verifier and then stores the result to the storage.
- Then finally the visualization application (hosted on the serverless instance) fetches the output file and renders for the user based on the defined settings.
Challenges and way ahead:
Currently the Bacalhau framework is still far cry of the famous docker orchestration framework k8s, given the fact that current infrastructure is being managed by the team voluntarily and users cant dynamically scale the infrastructure based on the requirements of the user jobs.
But there has been major progression from the Bacalhau team to run the ETL jobs and providing great tutorials for developers to setup their own cluster, along with very helpful features like pluggable executors coming eventually to run custom runtime and callback functions in order to sync the result from another pipeline operation based on the output of the previous operation.
So we are currently building tools and frameworks to build a scalable ETL based on the bacalhau and decentralised storage frameworks. our codebase is available open source here.
We are working on launching our first version of tools soon like:
- A bot based application allowing users to generate 3D map scan and formatted result based on the user.
- CLI tool for users to orchestrate geospatial data analysis and rendering jobs across various docker compute algorithms.
- Integrating 3D, computer vision transformer models for usecases like prompt to image generation etc.
So please follow our socials and github for updates.
We hope this article touched the basics about the nature of the compute-over-data for geospatial processing. If you have any questions or feedbacks, we’ll love to hear about it, you can reach out on our discord here.
